
Understanding the Issue
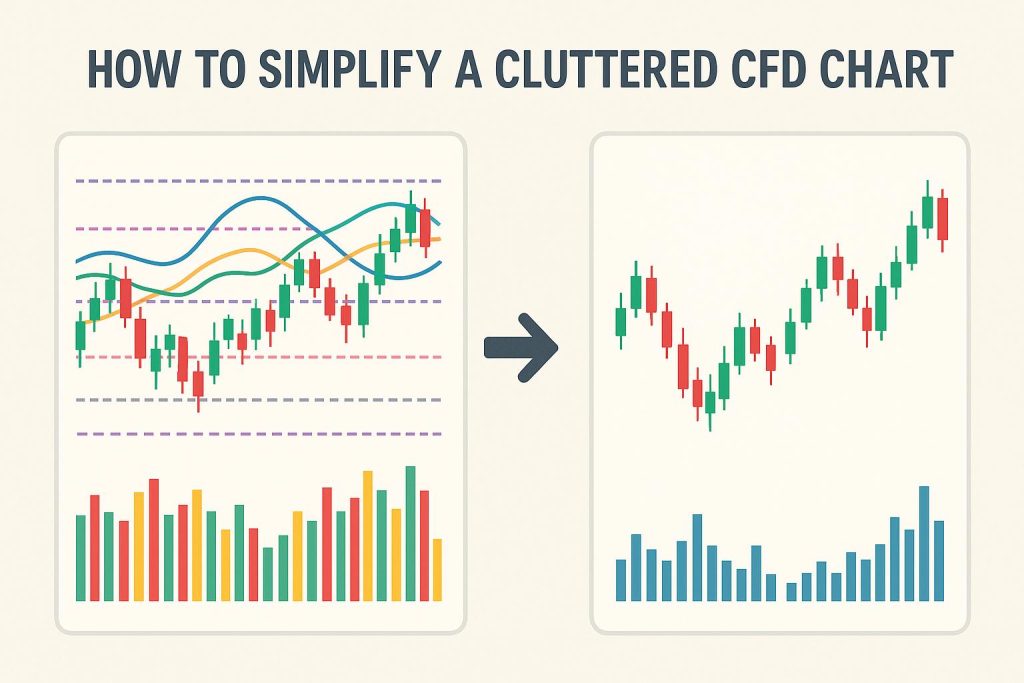
In the realm of data analysis and visualization, particularly when dealing with sophisticated tools like Computational Fluid Dynamics (CFD), presenting data in a clear and concise manner is crucial. Cluttered CFD charts often pose challenges, making it difficult to effectively analyze and interpret the underlying data. To maximize the effectiveness of these charts, simplification is vital. A simplified chart does not only enhance readability but also accentuates the insights hidden within the data. The following outlines several key strategies aimed at achieving clarity in CFD charts while ensuring that vital information is not lost in the process.
Consolidate Data
One of the primary methodologies for simplifying a CFD chart is through the consolidation of data points. When a chart displays every single data point available, it tends to appear crowded and can overwhelm the viewer. To avoid this, focus should be placed on key data points that represent pivotal trends or changes. For example, instead of showcasing data at every possible time step, it is more efficient to present data at significant intervals. This approach ensures that the chart conveys the most critical information, making it easier for viewers to discern patterns and trends without unnecessary distractions.
Use Meaningful Colors and Shading
The usage of color is a powerful method for information conveyance within charts. However, the effectiveness of color diminishes when overused. By keeping the color palette limited yet meaningful, confusion can be avoided. Each color should represent a specific variable or element within the data set. Employing consistent color schemes aids in distinguishing between various datasets, ultimately preventing viewer confusion. Furthermore, strategic usage of shading can spotlight key areas, drawing the viewer’s attention to important aspects of the data without contributing to visual clutter.
Optimize Legends and Annotations
Legends and annotations are integral to providing the necessary context within a chart. Yet, their excessive usage can contribute to visual disorder. By positioning legends outside the main chart area, the problem of overlapping with the actual data is minimized. Legends should carry concise labels, and annotations should be utilized sparingly to underscore crucial points without overcrowding the chart. This approach ensures that the viewer’s focus remains on the data instead of becoming distracted by extraneous information.
Utilize Appropriate Chart Types
The selection of an appropriate chart type is a significant factor in ensuring a clear and informative CFD chart. While line charts are widely used, other chart types may be more effective depending on the dataset. Streamlines or vector fields, for instance, can more precisely represent flow direction and magnitude. The chart type should be chosen based on its ability to accurately and clearly communicate the required insights. A well-chosen chart type allows viewers to quickly grasp the essence of the data without unnecessary complication.
Implement Interactive Features
The integration of interactive features in a CFD chart can substantially reduce visual clutter while maintaining comprehensive information availability. Features such as tooltips or clickable elements allow for details to be provided on demand. For example, hovering over a data point could reveal additional data values or context, enabling a clean visual presentation while still supplying users with all necessary information. This ensures that the primary focus remains on the data portrayed, while more detailed information is accessed only when needed.
Limit Axis and Grid Lines
While axis and grid lines provide necessary structure within a chart, their abundance can lead to overcomplication. A minimalist approach to grid lines should be adopted to maintain reference points without drawing attention away from the primary data. Additionally, axis labels need to be clear and concise, delivering essential information without burdening the viewer. The strategic limitation of distracting elements ensures the chart remains orderly and focused on delivering the key data insights.
Refine the Layout
Creating a simplified and effective chart can also be achieved through a refined layout. Ensuring there is adequate white space around the chart prevents feelings of overcrowding. Neat alignment of chart elements, along with purposeful placement, enhances the overall readability and flow of information within the chart. Each component should contribute clearly to the overall message of the chart, supporting the narrative rather than detracting from it.
In conclusion, the task of simplifying a cluttered CFD chart involves a series of strategic decisions regarding presentation. By focusing on data consolidation, meaningful color usage, and the inclusion of interactive elements, the chart becomes more accessible and inviting. Aspects such as legend optimization, layout refinement, and grid line adjustment play equally critical roles in ensuring the chart remains informative and effective for analysis. For those looking to further hone their skills in designing impactful visual representations, exploring expert resources on data visualization techniques can provide valuable insights and strategies.
This article was last updated on: October 23, 2026