
Understanding Weak Market Conditions in CFDs
When trading Contracts for Difference (CFDs), identifying weak market conditions is crucial for making informed decisions. Understanding these conditions can help traders minimize risks and optimize their strategies. In this article, we’ll explore key indicators and factors that signal a weakening market.
Declining Trading Volume
One of the primary indicators of weak market conditions in CFDs is a decline in trading volume. Trading volume refers to the total amount of asset units traded in a given timeframe. When trading volume decreases, it often indicates fewer market participants are actively engaging in buying and selling activities. This lack of participation often arises due to a prevailing sense of uncertainty or indecision among traders.
A decline in trading volume can also suggest impending price reversals or the continuation of a trend. In many instances, when volume reduces, the market often enters a phase of price consolidation. This phase can lead to less liquidity in the market, which makes executing trades at desired prices more challenging. Traders often have to adjust their strategies to account for these liquidity constraints, which might involve altering position sizes or being patient for better entry points.
Price Trends and Patterns
A close analysis of price trends and patterns is fundamental in recognizing weak market dynamics. Specifically, a prolonged period of sideways movement, where prices remain confined within a narrow trading range, could signify market indecision. This lack of clear directionality can indicate that neither buyers nor sellers have the upper hand, resulting in stagnation and potential weakening of market strength.
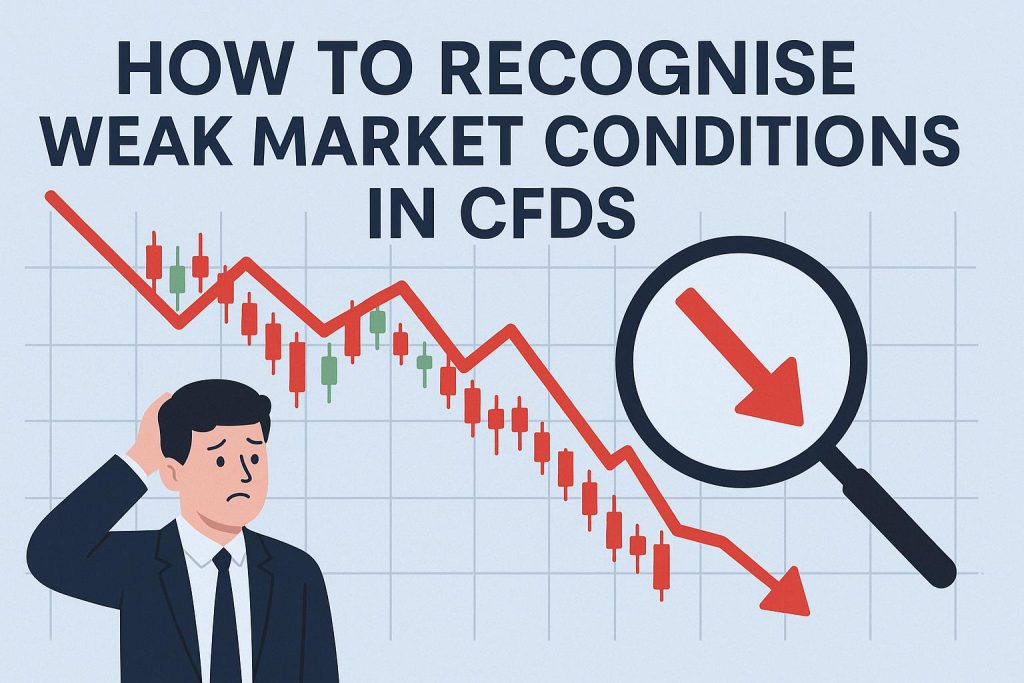
Another classic example is observing lower highs and lower lows on the price chart. This pattern often signals a downtrend, reflecting bearish sentiments where each successive price peak and trough is lower than the previous one. Traders view this as an indication of selling pressure overpowering buying interest, which can forecast further downward movements.
The identification and interpretation of these patterns require a strong understanding of technical analysis, as traders use this to anticipate potential shifts. Differentiating between temporary market pauses and the onset of more significant trends is crucial in making well-informed trading decisions.
Volatility Indicators
Volatility is a critical aspect to consider when evaluating weak market conditions. Low volatility generally indicates reduced market activity and price stability, which are characteristics of weakening conditions. Tools like the Bollinger Bands or Average True Range (ATR) are instrumental in measuring volatility levels.
When Bollinger Bands, which are plotted around a moving average, narrow or tighten, it suggests a decrease in volatility. Similarly, a declining ATR, which measures the average movement of asset prices over a specific period, indicates subdued price fluctuations. This reduction can imply that the market is in a state of uncertainty, awaiting a catalyst for more substantial movements. Traders often look for these periods as potential setups for breakout strategies, preparing for an eventual increase in price action.
External Economic Factors
Markets, including CFDs, are significantly influenced by external economic factors. These include economic reports, geopolitical developments, and policy shifts, which can introduce various levels of uncertainty and volatility. Such factors can either mitigate or exacerbate weakening market conditions.
For instance, when uncertainty prevails due to geopolitical tensions or unpredictable policy changes, market participants might adopt a cautious approach, leading to reduced trading volume and activity. Conversely, favorable economic indicators can sometimes contradict market sentiment if traders expect different outcomes, adding another layer of complexity to market analysis.
Therefore, staying informed of these external factors is crucial for traders, as they can help anticipate potential market shifts. Having a well-rounded understanding of how these elements interact with market dynamics allows traders to strategize accordingly.
Market Sentiment and News
Market sentiment is a vital factor in deciphering weak market conditions. It represents the overall attitude of investors and traders towards the market or a particular asset. This sentiment is often molded by media, analyst opinions, and social media discussions. Understanding this can give traders insights into the broader market psychology.
When prevailing sentiment is negative, it can contribute to weakening market conditions, where pessimism overshadows optimism among market players. Traders often analyze sentiment along with tangible data to form their market outlook. However, it is imperative to verify the credence and precision of the news sources, as misinformation can lead to misguided trading decisions.
Sentiment analysis thus forms an integral part of the decision-making process, enabling a balanced approach when interpreting market signals.
Technical Indicators
Various technical indicators serve as valuable tools in identifying weak market conditions for CFD traders. Notable indicators include the Relative Strength Index (RSI) and Moving Average Convergence Divergence (MACD). These indicators offer insights that help determine market condition statuses.
The RSI helps gauge market momentum by measuring the speed and change of price movements. An RSI reading below 30 typically indicates oversold conditions, potentially signaling a price reversal, while a reading above 70 suggests overbought conditions, indicating potential weakness. MACD, on the other hand, consists of two moving averages that help identify changes in market trends, momentum, and strength.
Traders incorporate these indicators to discern market strength and potential reversals. Understanding these signals helps in timing trades effectively, conferring a strategic edge when navigating uncertain market landscapes.
Conclusion
Recognizing weak market conditions in CFDs involves a nuanced approach encompassing trading volume, price trends, volatility, external economic influences, and market sentiment. Technical indicators further supplement this analysis by providing additional insight into potential market movements. By closely monitoring and synthesizing these elements, traders can make informed decisions that align with their risk tolerance and trading objectives. With CFD trading continually evolving, awareness and understanding of these indicators are pivotal in managing market challenges and sustaining trading performance.
This article was last updated on: August 14, 2026