
Understanding Support and Resistance in CFD Markets
Support and resistance are crucial concepts in trading, including the Contract for Difference (CFD) markets. These terms are used to describe the price levels on charts that tend to act as barriers, preventing the price of an asset from moving in a certain direction.
Defining Support and Resistance
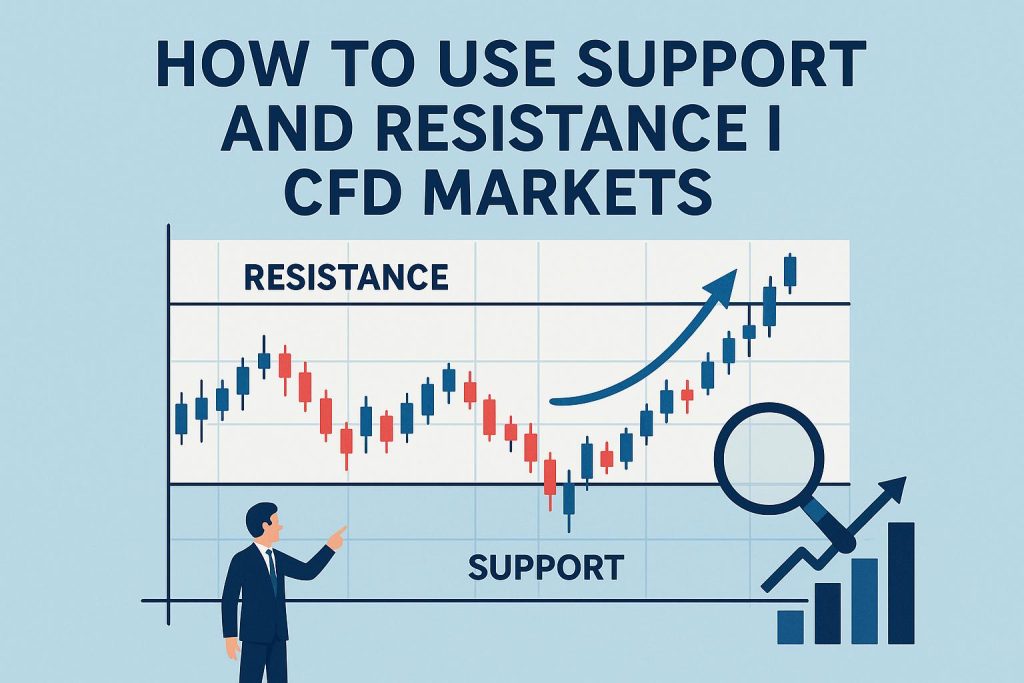
Support refers to a price level where a downtrend can be expected to pause due to a concentration of demand. As the price of an asset falls, demand for the shares increases, forming the support line. On the other hand, resistance occurs when the price advances to a level where selling interest is strong enough to overcome buying pressure.
Identifying Support and Resistance Levels
In practice, support and resistance levels can be identified using various techniques, such as moving averages, pivot points, and trendlines. These levels are often not exact figures but rather zones where prices fluctuate before changing direction. When traders can correctly identify these zones, they can make more informed decisions about entry and exit points, enhancing the profitability of their trades.
The Role of Psychological Pricing
An important aspect of support and resistance levels is the influence of psychological pricing. Round numbers commonly serve as these levels because they are areas where traders are likely to modify their buying and selling strategies, such as $100 for stocks or certain price levels for CFDs. When prices approach these psychologically significant numbers, traders often exhibit predictable behaviors, which can be factored into strategic decision-making.
Using Support and Resistance in CFD Trading
In CFD trading, understanding when an asset will reverse direction or continue its trend can offer significant advantages. Here are some ways traders can effectively use support and resistance levels:
Entry and Exit Points: By analyzing support and resistance levels, traders can make informed decisions about when to enter a trade or when to exit, optimizing their strategies for maximal gains. A well-timed entry can minimize risk and maximize returns, while an accurately chosen exit can preserve accrued profits.
Setting Stop Losses: Establishing stop losses below support levels in a long position, or above resistance levels in a short position, helps protect against excessive losses. This strategy reduces the downside risk, ensuring that a trader’s losses are capped if the market moves against them.
Trend Confirmation: Observing how a price reacts to support or resistance can confirm the direction of the prevailing trend. If prices consistently rebound from a support level and move upward, it often indicates a strong upward trend, whereas constant rejections from a resistance level typically signal a downward trend.
Breakouts and False Breakouts
A significant part of utilizing support and resistance is understanding breakouts and false breakouts. A breakout occurs when the price moves beyond a support or resistance level, indicating the potential for the trend to continue. On the other hand, a false breakout happens when the price moves slightly beyond a level only to return, which can trap traders into losing positions.
Implications of Breakouts
Recognizing the difference between breakouts and false breakouts involves monitoring the volume of trades and other market signals. High volume can indicate a genuine breakout, while low volume may suggest the breakout lacks the necessary momentum to sustain. By paying close attention to trading volumes and analyzing price action patterns, traders can better differentiate between true and false signals, mitigating potential losses from unsuccessful trades.
Breakouts often result from significant news events or shifts in market sentiment. When a genuine breakout occurs, it can herald a substantial price movement, offering an opportunity for traders to capitalize on the ensuing trend.
Trading Strategies Based on Breakouts
Traders must develop strategies to harness the potential of these breakouts effectively. Such strategies may involve entering trades immediately after a breakout is identified, provided the trading volume supports the price movement. Conversely, traders might cautiously await confirmation of the breakout by watching for additional price movement in the breakout’s direction. This approach reduces the likelihood of entering a false breakout scenario, leading to potential losses.
Challenges in Trading Support and Resistance
While the concepts of support and resistance are straightforward, their application in real-world trading requires nuanced understanding and experience. Market conditions, economic news, and trader psychology can all influence price movements, posing challenges for accurately predicting support and resistance levels.
Nuanced Decision-Making
Applying support and resistance in trading is not a mechanical process; it involves interpreting diverse market signals. For instance, experienced traders might combine support and resistance analysis with other indicators such as moving averages, RSI, or MACD to strengthen their decision-making process. Through practice and learning, traders can develop the ability to discern subtle changes in market conditions, enabling more effective usage of these levels.
Conclusion
Developing a thorough understanding of support and resistance levels is essential for any CFD trader. These levels offer a framework within which traders can plan their strategies, establish effective entry and exit points, and handle potential risks with well-placed stop losses. Utilizing these levels wisely requires practice and a nuanced interpretation of market signals, but once mastered, they are invaluable tools in the trader’s toolkit. By focusing on these areas, traders can enhance their ability to navigate the complexities of the CFD markets, improving their prospects of achieving sustained success.
This article was last updated on: June 12, 2026