
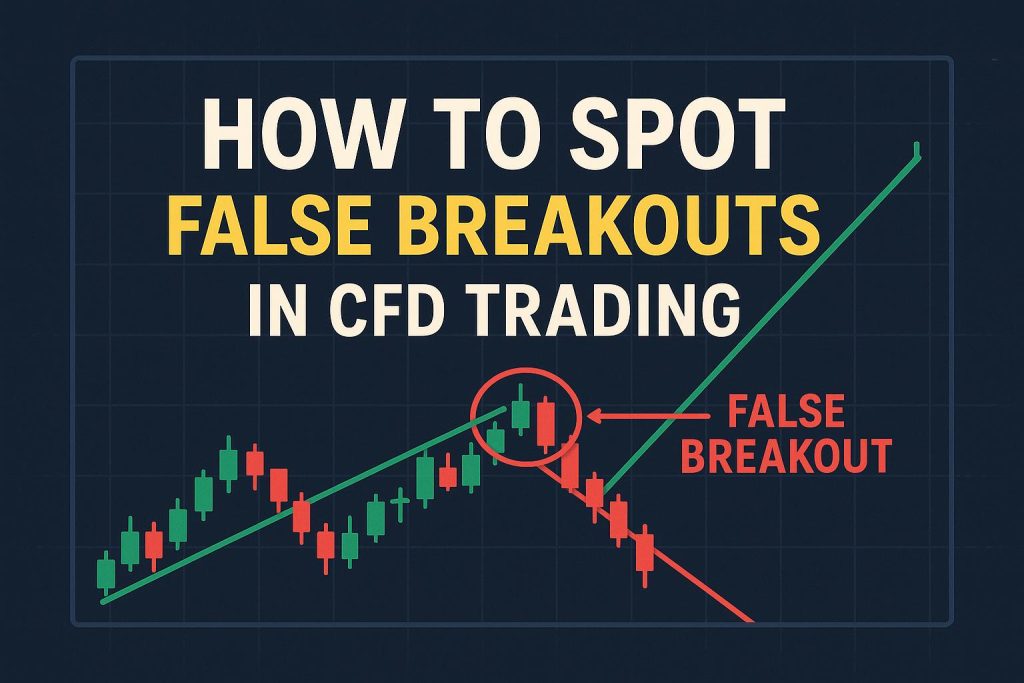
Understanding False Breakouts in CFD Trading
In the intricate domain of Contract for Difference (CFD) trading, recognizing and understanding false breakouts is crucial for traders aiming to make informed and strategic decisions. A breakout event occurs when the price of an asset moves beyond a previously established level of support or resistance. However, it is vital to comprehend that not every breakout signals a sustained trend continuation. Some breakouts are, in fact, false and distinguishing these can prove invaluable in saving traders from unwise investment decisions and potential financial losses.
Identifying Key Support and Resistance Levels
The cornerstone of identifying potential false breakouts lies in understanding key support and resistance levels within the market. These levels serve as psychological barriers where shifts in the market’s tendency to buy or sell occur. To reliably ascertain these levels, one must delve into thorough analysis of historical price data, determining where these critical levels have consistently presented themselves over time.
The usage of technical indicators such as moving averages, Fibonacci retracement levels, and Bollinger Bands serves as a significant aid for traders aiming to identify and affirm these support and resistance levels. These tools allow traders to pinpoint areas on a price chart where the price has historically stopped, reversed, or consolidated. Recognizing these patterns helps establish a framework for determining whether a breakout is genuine or false.
Volume Analysis
Analyzing trading volume is a powerful method for validating the authenticity of a breakout. Generally, a true breakout is distinguished by an increase in volume, signifying a strong market interest and conviction in the direction of the breakout. Conversely, a false breakout might manifest with limited volume, suggesting that the price movement lacks substantial backing or conviction from the market participants.
Additionally, assessing the volume pattern preceding the breakout can provide further insights. If the volume diminishes as the price approaches a resistance or support level, this may signal weakening momentum and enhance the likelihood of a false breakout. Such analysis is indicative of underlying market conditions which might not support a breakout continuation.
Examining Price Action and Candlestick Patterns
Price action offers real-time insights into market sentiment and is a critical component in assessing potential false breakouts. Traders frequently employ candlestick patterns as a visual aid to determine the chances of a breakout being false. For example, a candlestick with a long wick or shadow piercing a resistance or support level but subsequently closing back within the established range may reveal a lack of breakout strength.
Moreover, reversal patterns such as dojis, hammers, or shooting stars appearing near significant price levels further indicate potential false breakouts. The alignment of these patterns with the broader market context can substantially aid traders in making more informed and cautious trading decisions.
Beware of News and Market Events
External factors, particularly news events and economic announcements, significantly influence the reliability of breakouts. Market conditions during such occurrences often exhibit volatility, increasing the probability of false breakouts. It is imperative for traders to exercise caution and remain cognizant of the timing of economic data releases when assessing breakout validity.
Maintaining awareness of economic calendars and staying updated with pertinent financial news enables traders to gain essential context regarding possible market-moving events. Such a proactive approach helps in filtering breakouts that are more likely influenced by transient external factors than a genuine shift in market dynamics.
Utilizing Risk Management Tools
In the realm of trading, deploying effective risk management strategies is non-negotiable, especially amidst the uncertainties posed by potential false breakouts. One practical approach involves setting stop-loss orders just beyond support or resistance levels, thereby minimizing the potential for incurring significant losses.
While mastering the art of spotting false breakouts is an invaluable skill, it is essential to acknowledge that no method or strategy offers guaranteed outcomes. Consequently, maintaining disciplined risk management practices remains paramount, allowing traders to adeptly navigate the inherently unpredictable nature of financial markets.
Conclusively, through a meticulous approach encompassing the observation of support and resistance levels, volume analysis, candlestick pattern recognition, and consideration of external factors, traders are better equipped to protect themselves against false breakouts. By enhancing their CFD trading strategies with these insights, traders can improve decision-making and elevate their trading success.
This article was last updated on: July 10, 2026